Monitoring Metrics in BentoML with Prometheus and Grafana
Authors

Last Updated
Share

⚠️ Outdated content#
Note: Some of the content in this blog post may not be applicable. Please refer to the BentoML documentation for the latest information.
In the ever-evolving world of MLOps, the ability to observe, monitor, and analyze the operations of machine learning (ML) models has become increasingly important. Observability in MLOps is not just a buzzword — it's the foundation upon which we ensure the reliability, performance, and efficiency of deployed ML solutions. As such, having the right tools and processes in place to monitor model performance and system health becomes indispensable. Without proper observability, teams may find themselves flying blind, unable to identify potential issues until it's too late.
Now, how does BentoML fit into this picture? BentoML integrates seamlessly with Prometheus and Grafana, two of the most popular and powerful tools in the observability space. More specifically, BentoML automatically collects some default metrics for all API Servers and Runners with the help of Prometheus, such as the total number of requests; users can then visualize them through Grafana to set up alerts and create custom dashboards for more in-depth analysis. With the integration, ML practitioners can ensure that their models are not only performant but also robust and reliable.
So, how exactly do we achieve this integration? In this article, I will demonstrate how to monitor a BentoML project with Prometheus, create a custom histogram with a custom Runner, and create a custom dashboard in Grafana. The model involved in this project will be trained on the widely-used MNIST dataset of handwritten digits.
Let’s get started!
Before you begin#
This project's source code is available in the BentoML repository. Start by cloning the repository and navigating to the project directory:
git clone https://github.com/bentoml/BentoML.git
cd BentoML/examples/custom_model_runner
Let’s have a quick look at the key files in this project.
train.py: Trains an image classification model on the MNIST dataset, which is a collection of handwritten digits, and saves the model to the BentoML local Model Store with the namemnist_cnn.service.py: Defines the BentoML Service, including the model serving logic, API endpoint configuration, and preprocessing and postprocessing steps. You can start a server with it in either HTTP or gRPC modes. More details of this file will be given in the next section.requirements.txt: The required dependencies for this project.bentofile.yaml: Contains a set of configurations for building the Bento for this project, such as the Service, Python files, and dependencies. See the BentoML documentation to learn more about this file.net.py: Defines a convolutional neural network (CNN) model for image classification. It will be used bytrain.py.utils.py: Provides utility functions that are used in other parts of the project.locustfile.py: Locust is an open-source load testing tool that allows you to define user behavior with Python code, and then simulate traffic by simultaneous users to swarm your system. This file sends image requests (./mnist_png/testing/9/1000.png) to the/predictendpoint, pausing for a random duration (between 0.05 to 2 seconds) between requests.prometheus: This directory contains Prometheus configuration files for monitoring gRPC and HTTP traffic respectively. In both configurations, Prometheus scrapes metric targets every 5 seconds and evaluates established rules every 15 seconds.
Note: The machine I used in this demo runs Ubuntu 20.04. As the trained model is small, you don’t need high-performance hardware to run this project.
Testing the BentoML Service#
Before diving into the monitoring part, it's crucial to ensure the BentoML Service is running correctly. Here's a step-by-step guide to test it:
-
Install the required Python packages.
pip install -r requirements.txt -
Train a CNN model on the MNIST dataset using the
train.pyscript.python3 train.pyThis saves the model to the BentoML local Model Store.
$ bentoml models list Tag Module Size Creation Time mnist_cnn:2e5derdlzs64samo bentoml.pytorch 4.58 MiB 2023-10-16 02:36:32 -
Download the test data of a set of images with handwritten numbers ranging from
0to9. You can use them later for sending requests to the Service.wget -qO- https://github.com/myleott/mnist_png/raw/master/mnist_png.tar.gz | tar xz -
Before starting the Service, let’s take a look at the code.
from __future__ import annotations

from typing import TYPE_CHECKING

if TYPE_CHECKING:
    import PIL.Image

import time

import numpy as np
from utils import exponential_buckets

import bentoml

mnist_model = bentoml.pytorch.get("mnist_cnn:latest")
_BuiltinRunnable = mnist_model.to_runnable()

inference_duration = bentoml.metrics.Histogram(
    name="inference_duration",
    documentation="Duration of inference",
    labelnames=["torch_version", "device_id"],
    buckets=exponential_buckets(0.001, 1.5, 10.0),
)


class CustomMnistRunnable(_BuiltinRunnable):
    def __init__(self):
        super().__init__()
        import torch

        print("Running on device:", self.device_id)
        self.torch_version = torch.__version__
        print("Running on torch version:", self.torch_version)

    @bentoml.Runnable.method(batchable=True, batch_dim=0)
    def __call__(self, input_data: np.ndarray) -> np.ndarray:
        start = time.perf_counter()
        output = super().__call__(input_data)
        inference_duration.labels(
            torch_version=self.torch_version, device_id=self.device_id
        ).observe(time.perf_counter() - start)
        return output.argmax(dim=1)


mnist_runner = bentoml.Runner(
    CustomMnistRunnable,
    method_configs={"__call__": {"max_batch_size": 50, "max_latency_ms": 600}},
)

svc = bentoml.Service(
    "pytorch_mnist_demo", runners=[mnist_runner], models=[mnist_model]
)


@svc.api(input=bentoml.io.Image(), output=bentoml.io.NumpyNdarray())
async def predict(image: PIL.Image.Image) -> np.ndarray:
    arr = np.array(image).reshape([-1, 1, 28, 28])
    res = await mnist_runner.async_run(arr)
    return res.numpy()
This Service file does the following:
- Retrieve the MNIST model with
bentoml.pytorch.getand create the_BuiltinRunnableobject, a Runnable to wrap the model. - Define the
inference_durationhistogram metric. This metric measures the duration of inference. It has labels for torch version and device ID. Theexponential_bucketsfunction is used to define the bucket intervals for this histogram, determining the granularity of tracking. See the Prometheus Histogram documentation for more details. - Create a custom Runnable by subclassing
_BuiltinRunnable. This custom Runnable adds additional logging and metrics information with__init__and__call__. The__init__method logs the device and torch version being used, while the__call__method measures and records the duration of the inference using theinference_durationmetric defined earlier. Every time the model makes a prediction (i.e., every time the__call__method is invoked), the time taken for that prediction is measured and recorded in the Prometheusinference_durationhistogram metric. This allows for monitoring the model's inference performance over time and can provide insights into how the model's response time varies under different conditions or loads. - Create a Service object by wrapping the custom Runner, which is defined using the
CustomMnistRunnableclass. - Expose an API endpoint. It takes an image as input, reshapes it to the desired size, uses the custom Runner to get the prediction, and returns a NumPy array.
- Retrieve the MNIST model with
-
Launch the BentoML Service locally. You can then interact with the server at http://0.0.0.0:3000.
$ bentoml serve service:svc --reload 2023-10-16T08:33:45+0000 [WARNING] [cli] Using lowercased runnable class name 'custommnistrunnable' for runner. 2023-10-16T08:33:45+0000 [INFO] [cli] Environ for worker 0: set CUDA_VISIBLE_DEVICES to 0 2023-10-16T08:33:45+0000 [INFO] [cli] Prometheus metrics for HTTP BentoServer from "service:svc" can be accessed at http://localhost:3000/metrics. 2023-10-16T08:33:45+0000 [INFO] [cli] Starting production HTTP BentoServer from "service:svc" listening on http://0.0.0.0:3000 (Press CTRL+C to quit) 2023-10-16T08:33:47+0000 [WARNING] [runner:custommnistrunnable:1] Using lowercased runnable class name 'custommnistrunnable' for runner. 2023-10-16T08:33:47+0000 [WARNING] [api_server:8] Using lowercased runnable class name 'custommnistrunnable' for runner. 2023-10-16T08:33:47+0000 [WARNING] [api_server:5] Using lowercased runnable class name 'custommnistrunnable' for runner. 2023-10-16T08:33:47+0000 [WARNING] [api_server:7] Using lowercased runnable class name 'custommnistrunnable' for runner. 2023-10-16T08:33:47+0000 [WARNING] [api_server:2] Using lowercased runnable class name 'custommnistrunnable' for runner. 2023-10-16T08:33:47+0000 [WARNING] [api_server:4] Using lowercased runnable class name 'custommnistrunnable' for runner. 2023-10-16T08:33:47+0000 [WARNING] [api_server:3] Using lowercased runnable class name 'custommnistrunnable' for runner. 2023-10-16T08:33:47+0000 [WARNING] [api_server:1] Using lowercased runnable class name 'custommnistrunnable' for runner. 2023-10-16T08:33:47+0000 [WARNING] [api_server:6] Using lowercased runnable class name 'custommnistrunnable' for runner. 2023-10-16T08:33:47+0000 [WARNING] [api_server:10] Using lowercased runnable class name 'custommnistrunnable' for runner. 2023-10-16T08:33:47+0000 [WARNING] [api_server:12] Using lowercased runnable class name 'custommnistrunnable' for runner. 2023-10-16T08:33:48+0000 [WARNING] [api_server:9] Using lowercased runnable class name 'custommnistrunnable' for runner. 2023-10-16T08:33:48+0000 [WARNING] [api_server:11] Using lowercased runnable class name 'custommnistrunnable' for runner. Running on device: cuda Running on torch version: 1.12.1+cu116Note: Adding the
--reloadoption allows the Service to be reloaded when code changes are detected. -
Send a request to the
predictendpoint. Make sure you are in the project root directory when running the following command. The expected output should be3, which means the model thinks the sent handwritten number is likely to be3.curl -F 'image=@mnist_png/testing/3/76.png' http://127.0.0.1:3000/predict
If you see the following error when interacting with the server, it means the model's output tensor is on a CUDA device (most likely a GPU) and the Service is trying to convert it to a NumPy array directly. NumPy works on the CPU, so tensors from the GPU need to be moved to the CPU before you can convert them.
TypeError: can't convert cuda:0 device type tensor to numpy. Use Tensor.cpu() to copy the tensor to host memory first.
To solve this, modify the converting logic code in the service.py file, namely the line where the tensor is being converted to a NumPy array. Before conversion, the tensor should be moved to the CPU. Specifically, replace res.numpy() with res.cpu().numpy() in service.py as shown below:
@svc.api(input=bentoml.io.Image(), output=bentoml.io.NumpyNdarray())
async def predict(image: PIL.Image.Image) -> np.ndarray:
    arr = np.array(image).reshape([-1, 1, 28, 28])
    res = await mnist_runner.async_run(arr)
    # Replace `res.numpy()` with `res.cpu().numpy()`
    return res.cpu().numpy()
Send your request again and you should be able to see the expected output.
Running Locust for load testing#
With the server up and running, you can use the locustfile.py file with Locust to simulate multiple users sending requests to test the performance of model serving.
-
Install Locust.
pip install locust -
Make sure the BentoML Service is running and start Locust in another terminal:
$ locust -H http://0.0.0.0:3000 [2023-10-16 03:13:44,351] test/INFO/locust.main: Starting web interface at http://0.0.0.0:8089 (accepting connections from all network interfaces) [2023-10-16 03:13:44,359] test/INFO/locust.main: Starting Locust 2.17.0 -
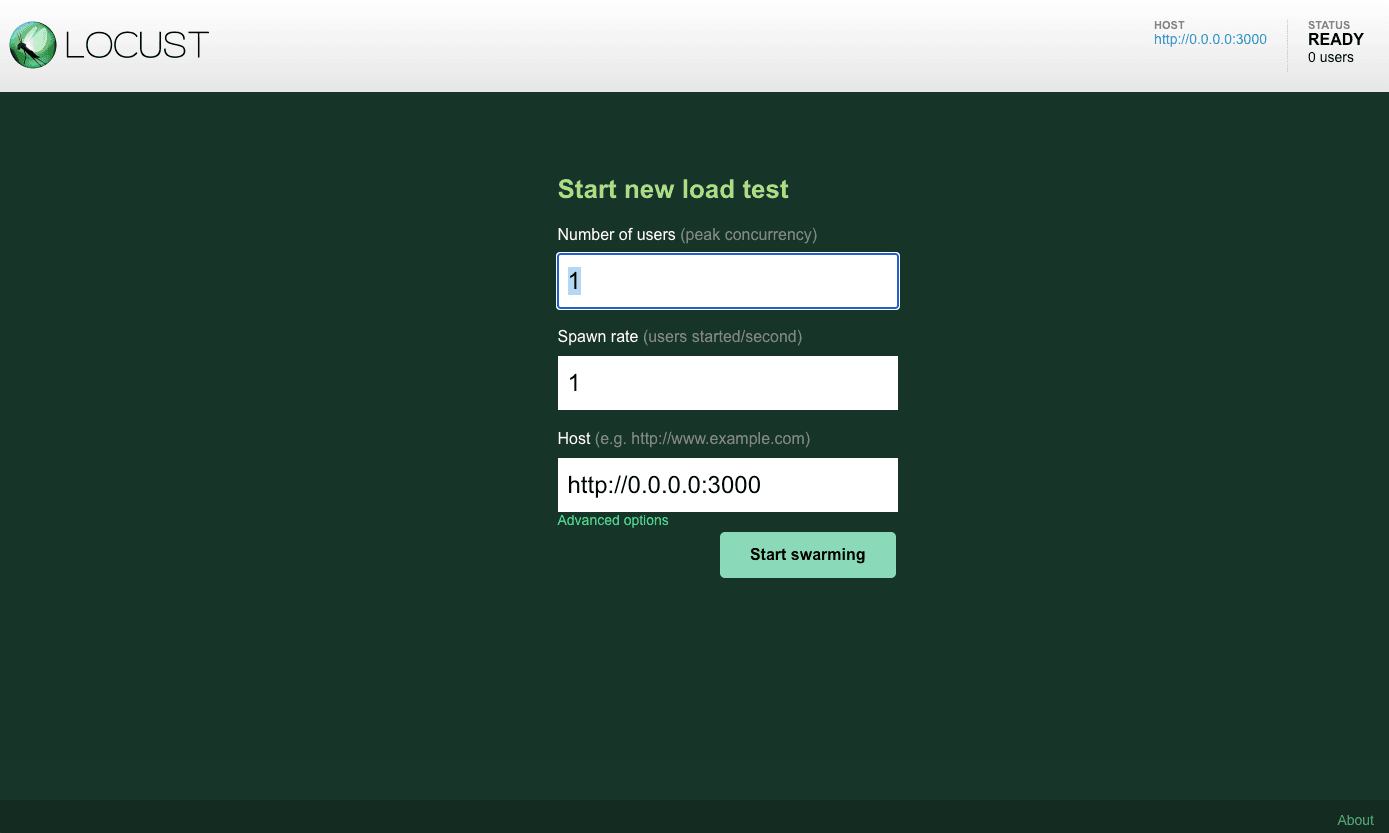
Visit the Locust web UI at http://0.0.0.0:8089. Set your desired number of users and spawn rate, then click Start swarming.
-
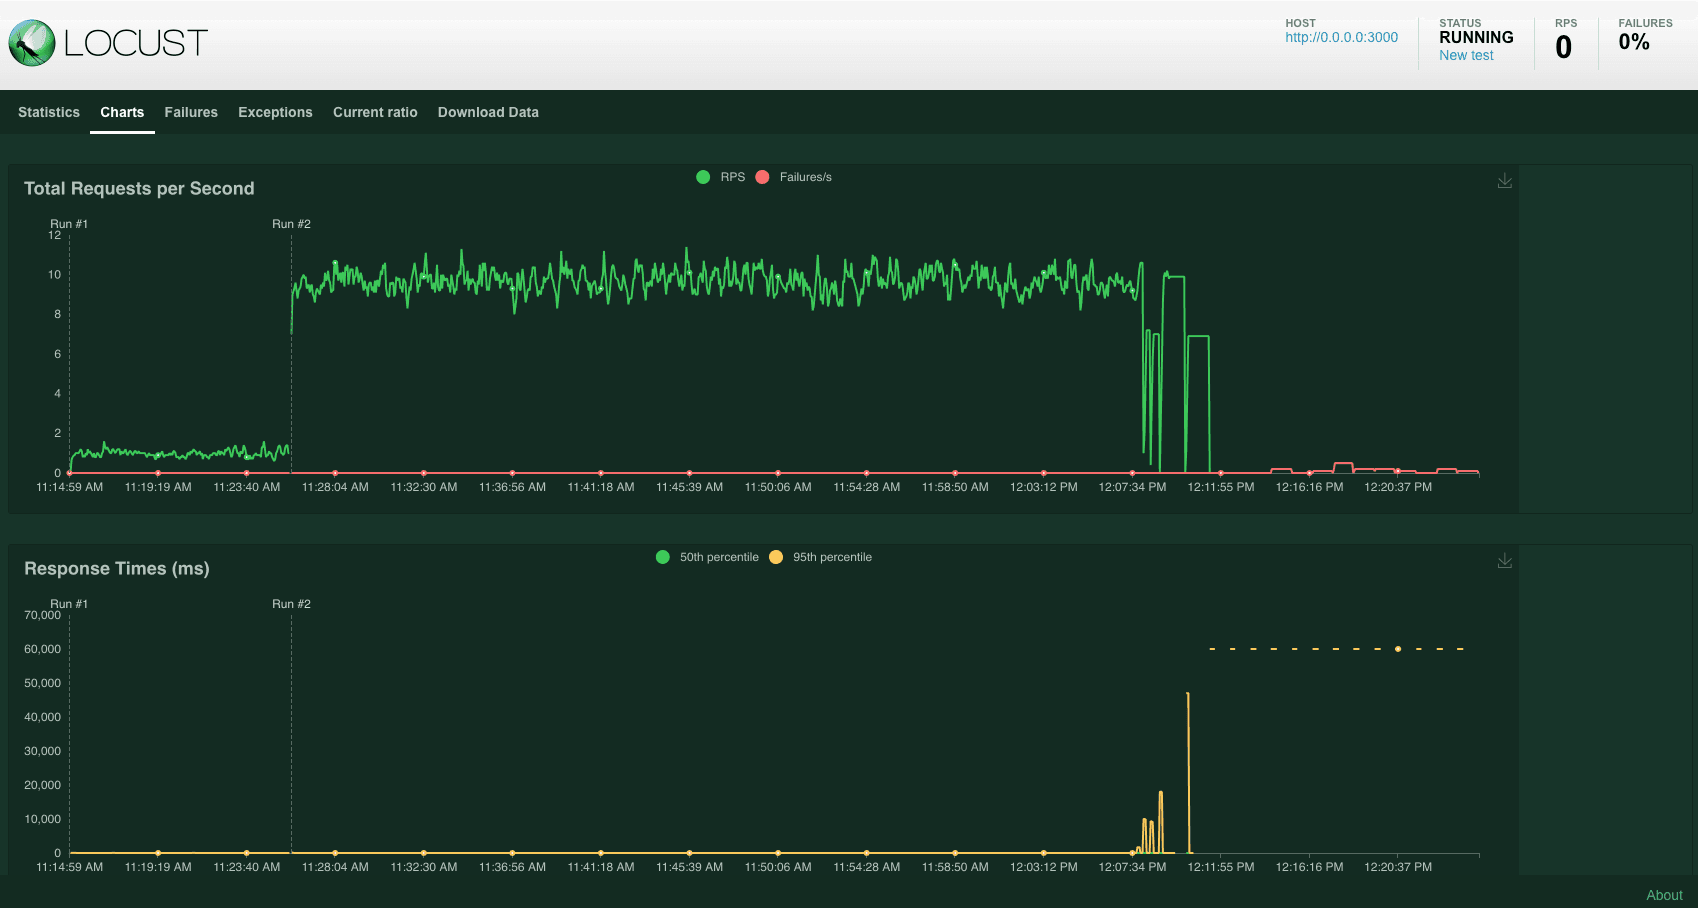
Monitor RPS (Requests Per Second) on the Charts tab to observe performance under loads.
Using Prometheus to scrape metrics#
Now that the server is actively processing requests sent by Locust, you can use Prometheus for further analysis.
-
Install Prometheus if you haven’t.
wget https://github.com/prometheus/prometheus/releases/download/v2.30.3/prometheus-2.30.3.linux-amd64.tar.gz tar xvfz prometheus-*.tar.gz cd prometheus-2.30.3.linux-amd64 -
Start Prometheus with either the gRPC or HTTP configuration. I used HTTP in this demo.
./prometheus --config.file=/path/to/the/file/prometheus.http.ymlExpected output:
... level=info ts=2023-10-16T03:08:20.258Z caller=web.go:541 component=web msg="Start listening for connections" address=0.0.0.0:9090 level=info ts=2023-10-16T03:08:20.258Z caller=main.go:822 msg="Starting TSDB ..." level=info ts=2023-10-16T03:08:20.261Z caller=tls_config.go:191 component=web msg="TLS is disabled." http2=false level=info ts=2023-10-16T03:08:20.263Z caller=head.go:479 component=tsdb msg="Replaying on-disk memory mappable chunks if any" level=info ts=2023-10-16T03:08:20.263Z caller=head.go:513 component=tsdb msg="On-disk memory mappable chunks replay completed" duration=2.545µs level=info ts=2023-10-16T03:08:20.263Z caller=head.go:519 component=tsdb msg="Replaying WAL, this may take a while" level=info ts=2023-10-16T03:08:20.264Z caller=head.go:590 component=tsdb msg="WAL segment loaded" segment=0 maxSegment=0 level=info ts=2023-10-16T03:08:20.264Z caller=head.go:596 component=tsdb msg="WAL replay completed" checkpoint_replay_duration=26.066µs wal_replay_duration=246.908µs total_replay_duration=328.11µs level=info ts=2023-10-16T03:08:20.265Z caller=main.go:849 fs_type=EXT4_SUPER_MAGIC level=info ts=2023-10-16T03:08:20.265Z caller=main.go:852 msg="TSDB started" level=info ts=2023-10-16T03:08:20.265Z caller=main.go:979 msg="Loading configuration file" filename=/home/sherlock/Downloads/BentoML/examples/custom_model_runner/prometheus/prometheus.http.yml level=info ts=2023-10-16T03:08:20.271Z caller=main.go:1016 msg="Completed loading of configuration file" filename=/home/sherlock/Downloads/BentoML/examples/custom_model_runner/prometheus/prometheus.http.yml totalDuration=6.399656ms db_storage=1.441µs remote_storage=1.939µs web_handler=930ns query_engine=1.306µs scrape=6.178752ms scrape_sd=30.604µs notify=1.332µs notify_sd=2.536µs rules=1.852µs level=info ts=2023-10-16T03:08:20.271Z caller=main.go:794 msg="Server is ready to receive web requests." -
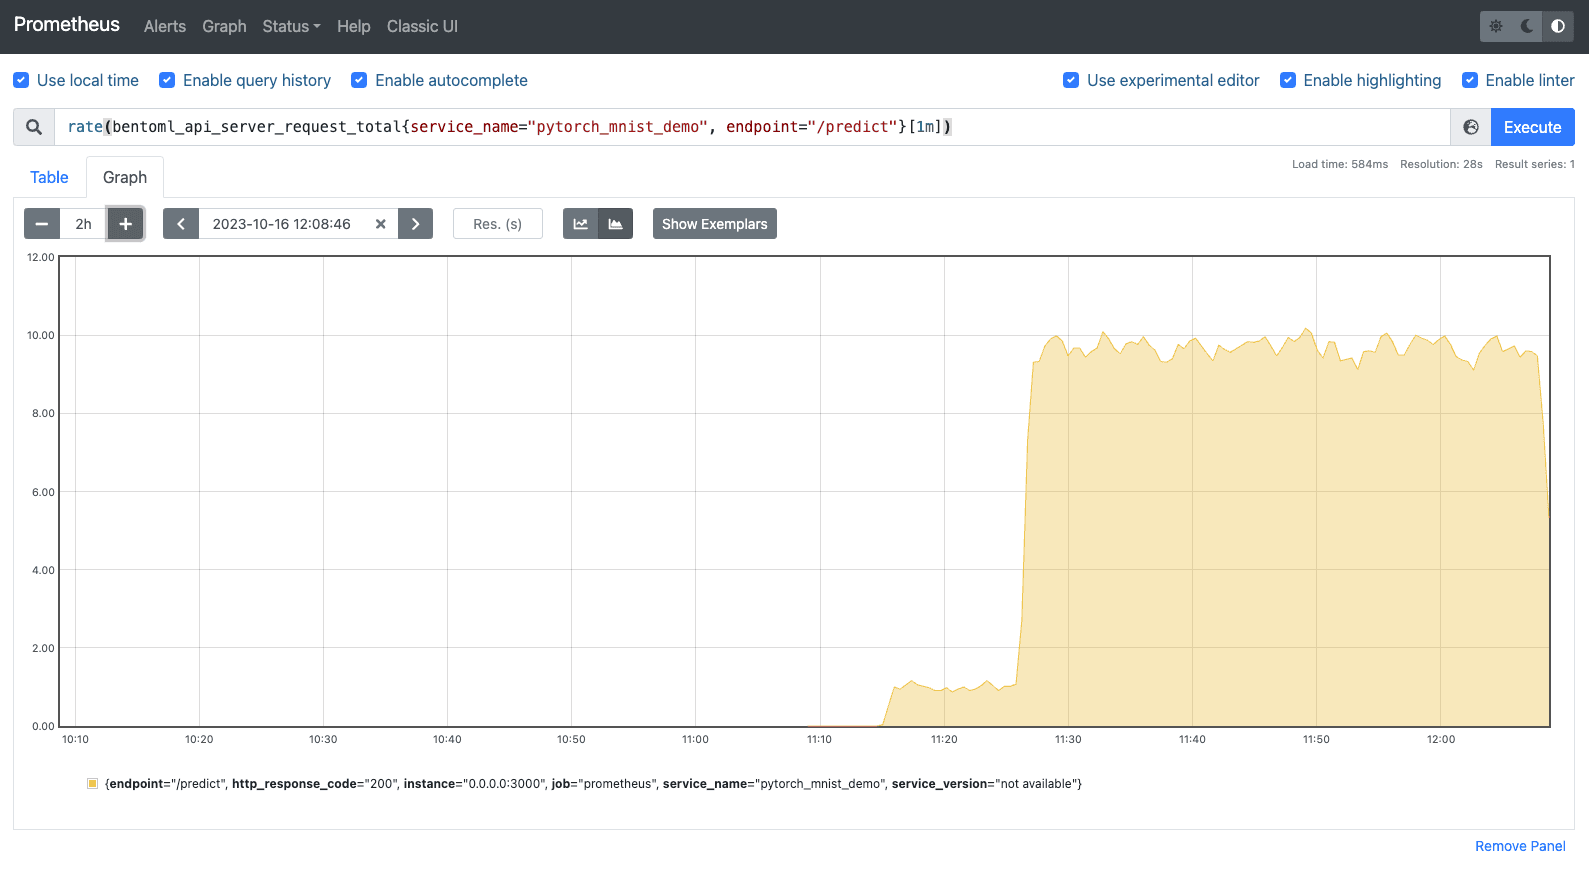
Prometheus should now be scraping metrics from the BentoML Service. To visualize these metrics, access the Prometheus web UI by visiting
http://localhost:9090(default Prometheus port). As I mentioned earlier, BentoML automatically collects a number of metrics for all API Servers and Runners, such asbentoml_api_server_request_in_progressandbentoml_runner_request_total. In addition, BentoML also allows you to define custom metrics.I used the following PromQL expression to return the average request count per second over the last 1 minute for the
/predictendpoint of thepytorch_mnist_demoService.rate(bentoml_api_server_request_total{service_name="pytorch_mnist_demo", endpoint="/predict"}[1m])Here is the graph:
-
Also, use the following PromQL expression for the 95th percentile inference latency:
histogram_quantile(0.95, rate(inference_duration_bucket[1m]))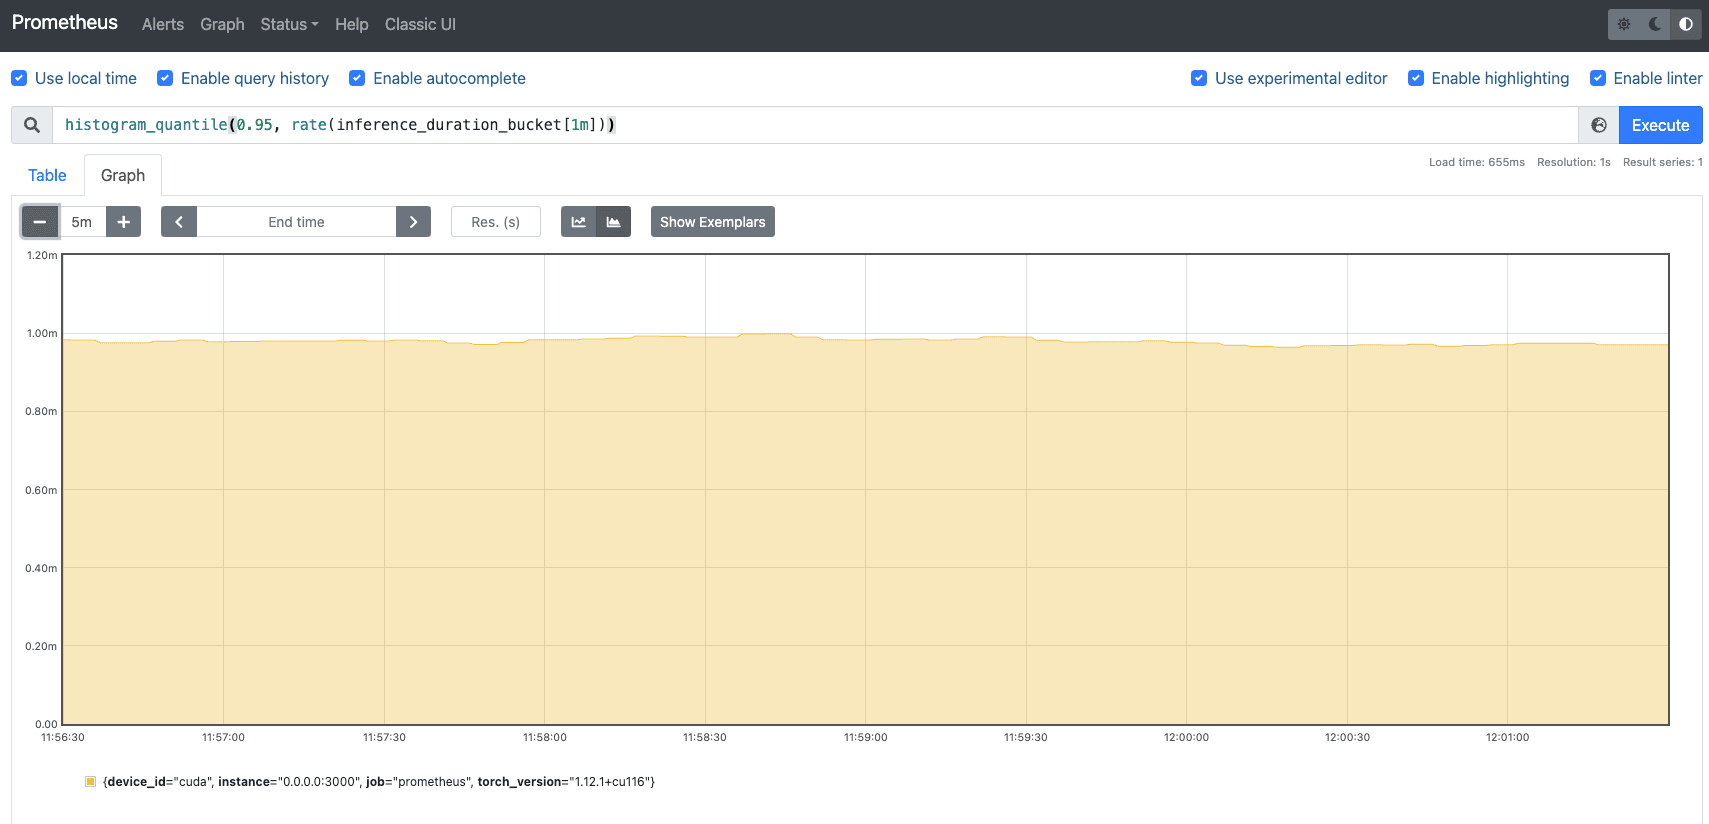
Creating a Grafana dashboard#
For a more advanced visualization, you can consider setting up Grafana and integrating it with Prometheus. Grafana provides a feature-rich platform to create dashboards that display metrics collected by Prometheus.
-
Make sure you have installed Grafana. The commands may be different depending on your system. See the Grafana documentation for details.
sudo apt-get install -y software-properties-common sudo add-apt-repository "deb https://packages.grafana.com/oss/deb stable main" curl https://packages.grafana.com/gpg.key | sudo apt-key add - sudo apt-get update sudo apt-get install grafana -
Start Grafana.
sudo systemctl enable grafana-server sudo systemctl start grafana-server -
If your BentoML Service is running on port
3000and you've started Grafana, which by default also runs on port3000, you'll encounter a port conflict. To solve this, configure Grafana to run on a different port. Do the following:-
Open the Grafana configuration file.
sudo nano /etc/grafana/grafana.ini -
In this file, look for the
[http]section. You'll see a line that looks like this:;http_port = 3000 -
Change the port number to an available port like
4000, and remove the semicolon (;) at the beginning to uncomment the line:http_port = 4000 -
Save the file and restart the Grafana service for the change to take effect:
sudo systemctl restart grafana-server
-
-
Access the Grafana web UI at
http://localhost:4000/(use your own port). The default login information isadminfor both the username and password. You'll be prompted to change the password. -
In the Grafana search box at the top, enter “Data sources” and add Prometheus as an available data source. In the HTTP section, set the URL to
http://localhost:9090(or wherever your Prometheus instance is running). Save the configuration to ensure Grafana can connect to Prometheus. -
Add a new Grafana dashboard based on your desired metric. I created the following dashboard using the
bentoml_api_server_request_totalmetric for your reference:
Once you are happy with the results, use the bentofile.yaml file to build a Bento by running bentoml build. You can then containerize it or deploy it to BentoCloud.
Conclusion#
In the rapidly evolving world of machine learning and AI, having a reliable and efficient deployment tool is crucial. Equally important is the tool's ability to offer powerful observability, ensuring you stay informed about your application's health and performance. I hope that you find this tutorial helpful, especially in gaining insights from key model serving metrics. Happy coding!
More on BentoML#
To learn more about BentoML, check out the following resources:
- [Doc] BentoML Metrics
- [Blog] OpenLLM in Action Part 1: Understanding the Basics of OpenLLM
- [Blog] Deploying An Image Segmentation Model with Detectron2 and BentoML
- [Blog] BYOC to BentoCloud: Privacy, Flexibility, and Cost Efficiency in One Package
- Don’t miss out on the chance to be an early adopter! BentoCloud is still open for early sign-ups. Experience a serverless platform tailored to simplify the building and management of your AI applications, ensuring both ease of use and scalability.